
878 luminaires, six months, −48 % beyond the LED.
The largest of the three installations in the published study, and the one that answers the usual objection: that adaptive lighting works on a demonstration stretch but not across a real network carrying real traffic.
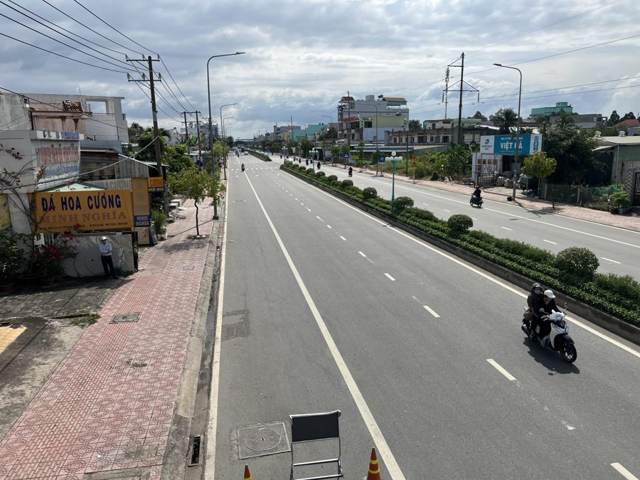
Main road under adaptive control — installed site
A city network, not a test bench.
The adaptive installation covers 878 of the city's luminaires, on about 22 km of main roads, inside a network of roughly 3,800 points. The roads carry the mixed, dense traffic of a provincial capital: heavy at dusk, thin after midnight, and never zero.
That mix is what makes the result meaningful. There is no window in which the road is empty enough to switch anything off; the saving comes entirely from lighting each hour for the traffic that hour actually carries, within the classes the standard allows.
693 kWh per day, measured on the same LED luminaires running on an astronomical clock — the installation as it was before adaptive control was switched on.
Six months of continuous operation, with the consumption measured by the nodes themselves.
The sensors do not multiply with the luminaires.
Eight hundred luminaires do not need eight hundred sensors. Each stretch is instrumented once — traffic, luminance, weather — and the decision reaches every node on it over the mesh, in real time.
Per stretch
A counting radar and a luminance unit for the road, not for the pole.
Per cluster
One gateway for 100 to 150 nodes: about six for this installation, not 878 SIM cards.
Per luminaire
One node, driving the driver and measuring its own consumption hour by hour.
Per night
Thousands of class decisions, each stored with the measurement that justified it.
The three installations, side by side.
All measured against the same LEDs on an astronomical clock, all in the same published study. The difference between them is the class of the roads, not the quality of the system.
Pasolini et al., Sensors 24(18):5942, 2024 — with the University of Bologna and CNIT; Wi4B researchers among the authors, conflict of interest declared.
Two networks on different continents, with different traffic cultures, landed within three points of each other. The physics of an over-lit empty road is not local.
Where the design class is already low there is far less room above the minimum, and the same system measured half as much. We say so before the tender does.
Nothing exotic.
The installation is the standard architecture, at a size that makes its economics visible.
One per luminaire
Fitted on the socket, driving the driver, measuring energy per hour.
A few per stretch
Traffic counting, road luminance and a weather station that suspends reduction in fog.
The site's own mesh
2.4 GHz, clusters of 100–150 nodes, no per-device subscription.
Reports and evidence
Consumption per point and per hour, and the decisions behind every level.
Have a network of this size?
Send the number of points, the classes and the current consumption. We will come back with what adaptive operation is worth stretch by stretch — including the stretches where it is not worth much.